
Maximum drawdown shows you the biggest drop your investment takes from its highest point to its lowest point. our Maximum Drawdown Calculator helps you see exactly how much risk you’re taking.
Simply enter your peak value and lowest value, and you’ll get your answer in seconds. Works for stocks, crypto, forex, or your whole portfolio.
What is Maximum Drawdown?
Maximum drawdown is the biggest fall your investment or portfolio takes from its top point to its bottom point. It tells you how much money you lost during the worst time. For example, if your portfolio was worth $10,000 and dropped to $7,000, your maximum drawdown is 30%. This number helps you understand the risk you’re taking and how hard it might be to recover your money.
How to Use Our Maximum Drawdown Calculator?
Calculating maximum drawdown is super easy. You just need two numbers from your investment history. Let me show you exactly how it works.
Step 1: Find Your Peak Value
Look at your portfolio or stock history. Find the highest point it ever reached. That’s your peak value. For example, if your account hit $50,000 at its best, that’s your peak.
Step 2: Find Your Lowest Value After Peak
Now look for the lowest point that came after that peak. This is your trough value. Let’s say your account dropped to $35,000. That’s your lowest point.
Step 3: Choose Your Currency
The tool above lets you pick any currency you want – USD, PKR, EUR, or any other. You can even use different currencies for peak and lowest values. The calculator changes them for you automatically.
Step 4: Click Calculate
Just type your two numbers in the boxes above. Pick your currency. Then hit the blue “Calculate Maximum Drawdown” button. You get your answer in one second.
The tool also tells you if your drawdown is low risk (under 10%), moderate (10-30%), high (30-50%), or very high (over 50%). This helps you know what you’re dealing with.
Here’s something most people don’t know: the recovery time changes everything. If you lose 50%, you need to gain 100% just to break even. That’s why the tool has a CAGR (yearly growth rate) calculator built in. You can also use our free Compound Interest Calculator to see how reinvesting your gains can speed up recovery.
Maximum Drawdown Formula Explained
The formula is easier than you think. Here’s what you need:
Where:
- MD = Maximum drawdown (in percent)
- LP = Lowest value after peak value
- PV = Peak value
Think of it like this. You find your highest point (PV). Then you find where you fell to (LP). The formula tells you how far you dropped as a percentage.
Let me show you with stocks. The S&P 500 dropped during COVID-19 in early 2020. It went from $340 down to $218. Using the formula: ($218 – $340) / $340 × 100 = -35.9%
That’s a 35.9% drawdown. Scary, right? But it came back.
Now look at Bitcoin. In 2021, it hit $69,000. Then it crashed to $15,500 by late 2022. That’s: ($15,500 – $69,000) / $69,000 × 100 = -77.5%
A 77.5% drawdown. Way worse than stocks.
This shows you something important. Crypto can drop much harder than regular investments. That’s why smart people put less money in Bitcoin and more in safer things like ETFs. The calculator at the top does this math instantly. No need to grab a pen and paper.
Just type your numbers and see your risk level. If you hold dividend stocks, you can also use our free Dividend Calculator to check how much income you’d earn even during drawdowns
Maximum Drawdown Examples
Real examples help you understand drawdowns better. Let me show you what happened to actual investments so you can see how this works in real life.
Stock Market Drawdown Example
The S&P 500 gave us a perfect example in March 2020 when COVID-19 hit. Everyone panicked. Stocks crashed fast.
Here are the real numbers. The S&P 500 peaked at $3,386 on February 19, 2020. Then it dropped to $2,237 by March 23, 2020. That’s just 33 days.
Let’s do the math: ($2,237 – $3,386) / $3,386 × 100 = -33.9%
A 33.9% drawdown in one month. People lost a third of their money. Many sold everything in fear.
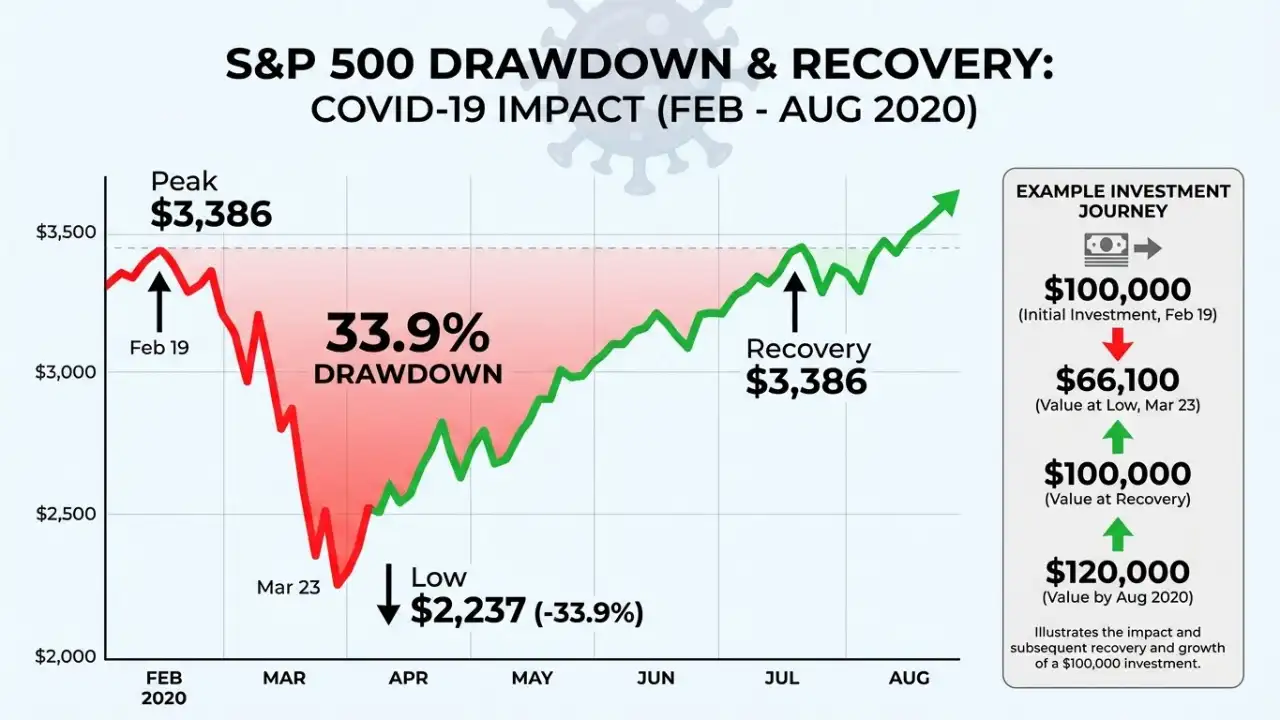
But here’s the interesting part. The recovery took only 5 months. By August 2020, the S&P 500 was back to its peak. Then it kept going up.
If you had $100,000 in February, you watched it drop to $66,100 in March. Scary stuff. But if you held on, you were back to $100,000 by summer. Then up to $120,000 by year’s end.
This shows you something important. Big drawdowns happen fast. Recovery can happen fast, too if you don’t panic sell.
Why Maximum Drawdown Matters for Investors
Most people only look at how much money they made. But drawdown tells you the real story – how much you can lose.
Here’s why it matters. If your portfolio drops 50%, you need to make 100% just to get back to zero. Not 50%. Double that. The math gets worse as you lose more.
I’ve seen people quit investing forever after one big drawdown. They couldn’t handle watching their money disappear. That’s the emotional side nobody talks about.
Risk assessment
Risk assessment is the first reason you need this. Before you buy any stock or crypto, check its worst drawdown in history. If Bitcoin dropped 80% before, it can do it again. Can you sleep at night knowing that?
Portfolio management
Portfolio management is the second reason. Smart investors mix safe and risky assets. If one thing has a 60% drawdown risk, you don’t put all your money there. You spread it around. You can also use our free Full-Time Equivalent (FTE) Calculator to plan resources and manage your investments or business projects efficiently
The recovery
The recovery part is what kills most people. Let’s say you lose 40%. You need a 66% gain to recover. Lose 60%? You need a 150% gain. These numbers show why protecting against big losses matters more than chasing big gains.
Banks and hedge funds use maximum drawdown to measure every investment. They know something you should know, too – it’s easier to avoid big losses than to recover from them.
Use the calculator above before your next trade. It might save you years of pain.
Final Thoughts
Maximum drawdown shows you the real risk in any investment. It’s not about how much you make – it’s about how much you can lose and still recover.
Use the calculator above before you put money anywhere. Check the drawdown history. Know what you’re getting into. Smart investors protect their money first, then chase gains.
Your future self will thank you for doing this simple check today.
Frequently Asked Questions
What is a good maximum drawdown percentage?
A drawdown under 20% is good for most investors. Anything over 50% means a very high risk and a tough recovery.
How long does it take to recover from a drawdown?
It depends on your CAGR (growth rate). A 30% drawdown needs about 2-3 years at 15% yearly growth to recover.
Is maximum drawdown the same as loss?
No. A loss is when you sell. Maximum drawdown shows the biggest drop while you still hold the investment.
Can I use this calculator for crypto and forex?
Yes. The calculator works for stocks, Bitcoin, forex, ETFs, or any portfolio. Just pick your currency.
What's the difference between drawdown and volatility?
This calculator was created by the InterCalculator Editorial Team, led by Haris Farooq (Formula & Development). Our team specializes in formula research, calculator logic, and technical development, ensuring each tool is accurate, fast, and easy to use.
View Team →Before publishing, every calculator goes through the InterCalculator Accuracy Review Process. For the Maximum Drawdown Calculator, we verify formulas against trusted sources and test calculations using multiple historical market scenarios and portfolio data. All calculations are reviewed with an experienced banking expert to confirm accuracy, clarity, and reliability.
View Process →